
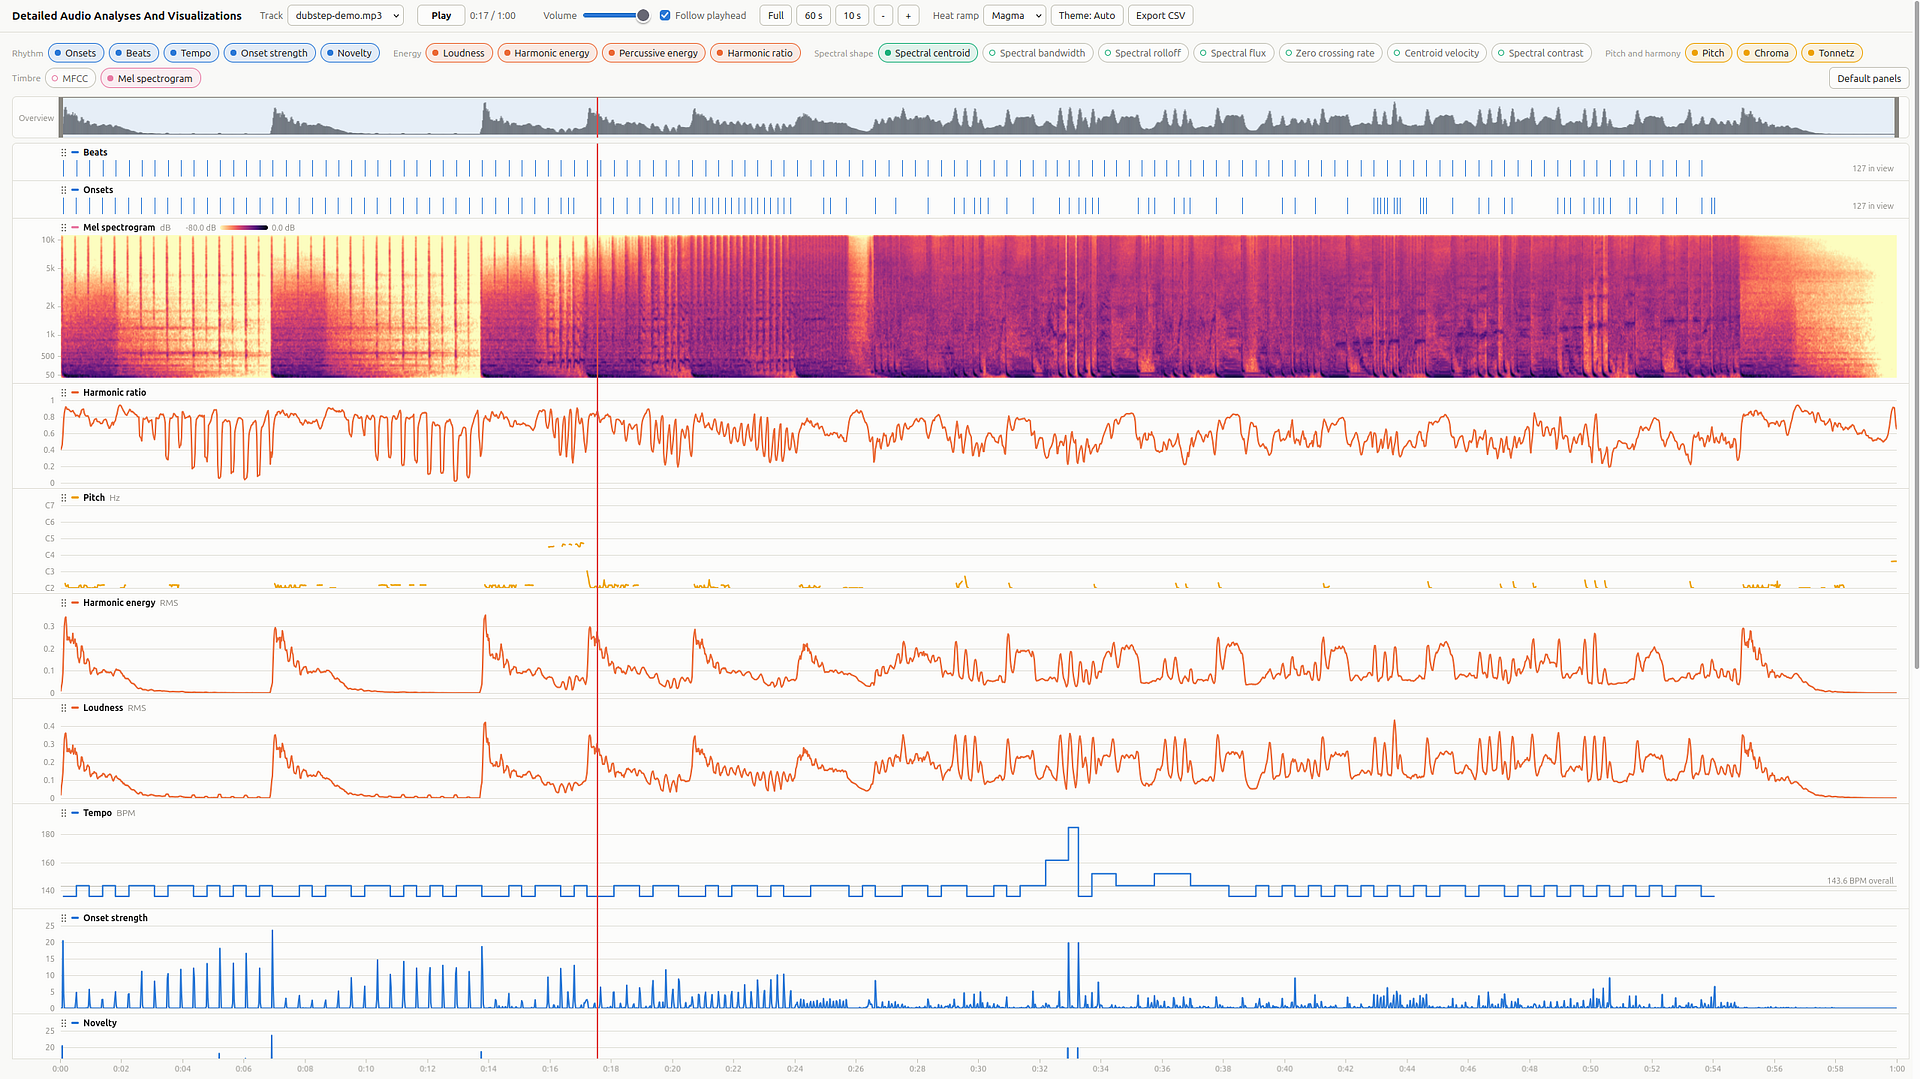
Analyze and visualize how rhythm, timbre, loudness, pitch, spectral characteristics and other key audio features evolve over time across any number of tracks.
The backend Python script is an audio analysis and visualization tool for processing .mp3 and .wav files from the local audio directory and converting them into a detailed .json dataset. Using Python, Librosa, NumPy and concurrent processing, this app extracts a wide range of audio features. The result is a data directory containing an index.json file listing analyzed tracks, plus a folder for each track holding one .json file per feature. Together these files capture how each musical and acoustic property changes over time for every analyzed track.
Whereas the frontend turns the Python analysis data into an interactive experience using D3.js. For each audio file, the app creates a playback interface, then renders toggleable charts for extracted features. This lets users listen to a track while visually inspecting it. Overall, this application functions as a detailed audio fingerprinting and comparison system, useful for exploring sound design, studying musical characteristics, comparing tracks or building visual representations of audio files.
Below are the required software programs and instructions for installation and use of this software application on a Linux machine.
-
Install the above programs
-
Open a terminal
-
Clone this repository:
git clone git@github.com:devbret/detailed-audio-analysis.git -
Navigate to the repo's directory:
cd detailed-audio-analysis -
Create a virtual environment:
python3 -m venv venv -
Activate your virtual environment:
source venv/bin/activate -
Install the needed dependencies:
pip install -r requirements.txt -
Add the audio files you wish to analyze to the local
audiofolder -
Run the main Python script:
python3 app.py -
Start a local HTTP server:
python3 -m http.server -
Open the frontend to explore processed data:
http://localhost:8000 -
Stop the HTTP server when finished:
Ctrl + C -
Exit the virtual environment:
deactivate
Below you will find information not covered in the installation and use sections above. Including the abilities this repo is intended to demonstrate. As well as an overview of the license this code is made available with. And a way to contact the maintainer with questions, suggestions and collaboration opportunities.
This project repo is intended to demonstrate an ability to do the following:
-
Analyze
.mp3and.wavfiles from theaudiodirectory and save detailed audio feature data as.jsonfiles in thedatadirectory -
Extract characteristics such as tempo, onsets, loudness, MFCC timbre, mel spectrogram values and others
-
Load the generated
.jsondata and create D3.js visualizations for each analyzed audio track -
Enable users to play, stop and adjust volume, as well as toggle individual charts to compare how each feature changes over time
Analysis time and output size both grow with the length and number of your tracks. As an example, putting one sixty-second dubstep track through this program produced 2.9 MB of data and took about seventeen seconds to compute.
The frontend only loads the data for the charts you have open, rather than every feature at once.
This repository is distributed under the MIT License. You are free to use, copy, modify, merge, publish, distribute, sublicense and sell copies of this software, including as part of proprietary or commercial work. The single condition is the copyright and permission notices contained in the LICENSE file must be included with any copy or substantial portion of the software that you redistribute. The software is provided "as is", without warranty of any kind, and the copyright holder is not liable for any claim or damages arising from its use.
If you have any questions or would like to collaborate, please reach out either on GitHub or via my website.